Stream Data On-Demand
Connect your data within a matter of seconds, and control how your data flows through our platform. No longer, do you need to migrate all your data for your business intelligence and analytics use cases, allowing you to maintain a single source of truth for your data, whilst analysing the data within DataMPowered; observing data insights, instantly.
The future of Data Connection
Safely and securely stream your data from your chosen data repositories through our platform. They ensure that you have a comprehensive and fully governed path to your data, regardless of its source and format. DataMPowered does not create a repository within its platform, rather allows users to connect the sources of data they wish to analyse.
DataMPowered’s comprehensive library of connectors, help you connect your data sources to our platform safely and securely, whether it is from your existing databases, cloud applications or local files.
We offer 4 types of connectors, which shall be explored in detail below.
Plug 'n' Play. Connectors for all Scenarios
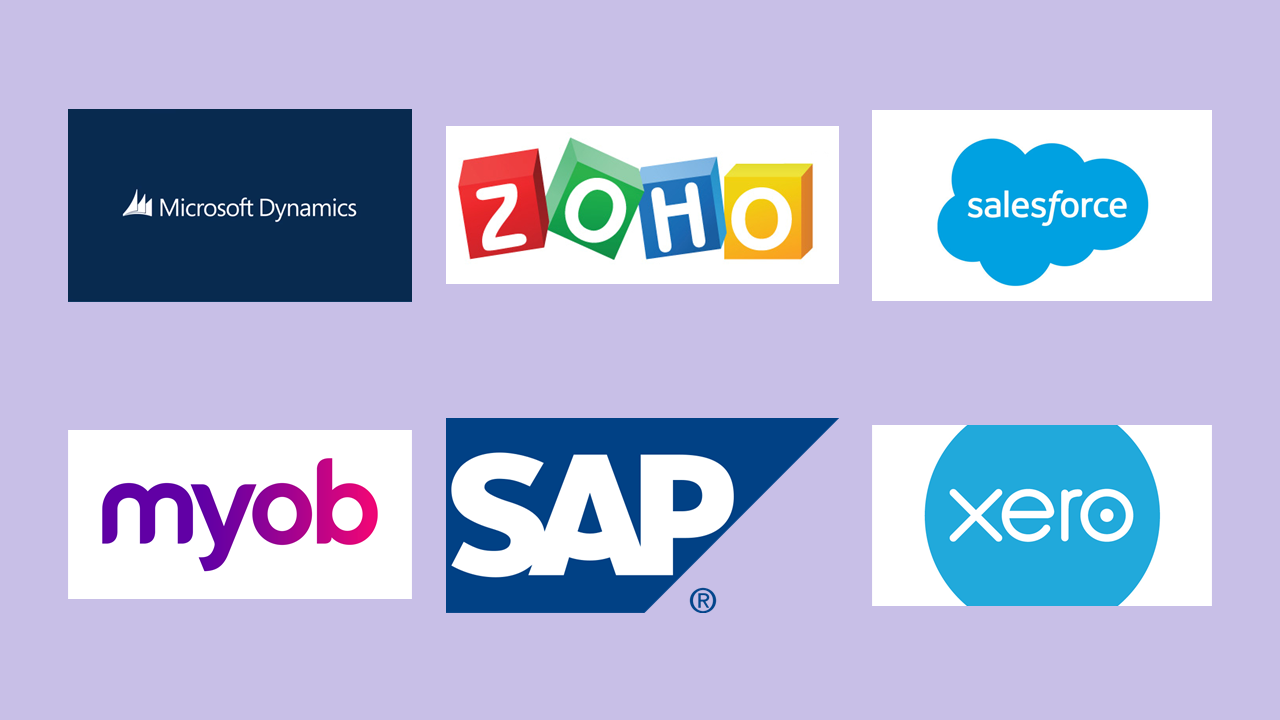
Vertical Connectors
These connectors are specifically designed for an use case you wish to explore, whether that is accounting packages (such as MYOB, Xero, or Quickbooks), CRM (like SalesForce, Zoho or HubSpot), ERP (for example: SAP, Microsoft Dynamics or SAGE) or various types of POS systems (e.g. Clover, Lightspeed or Shopify), we have you covered.
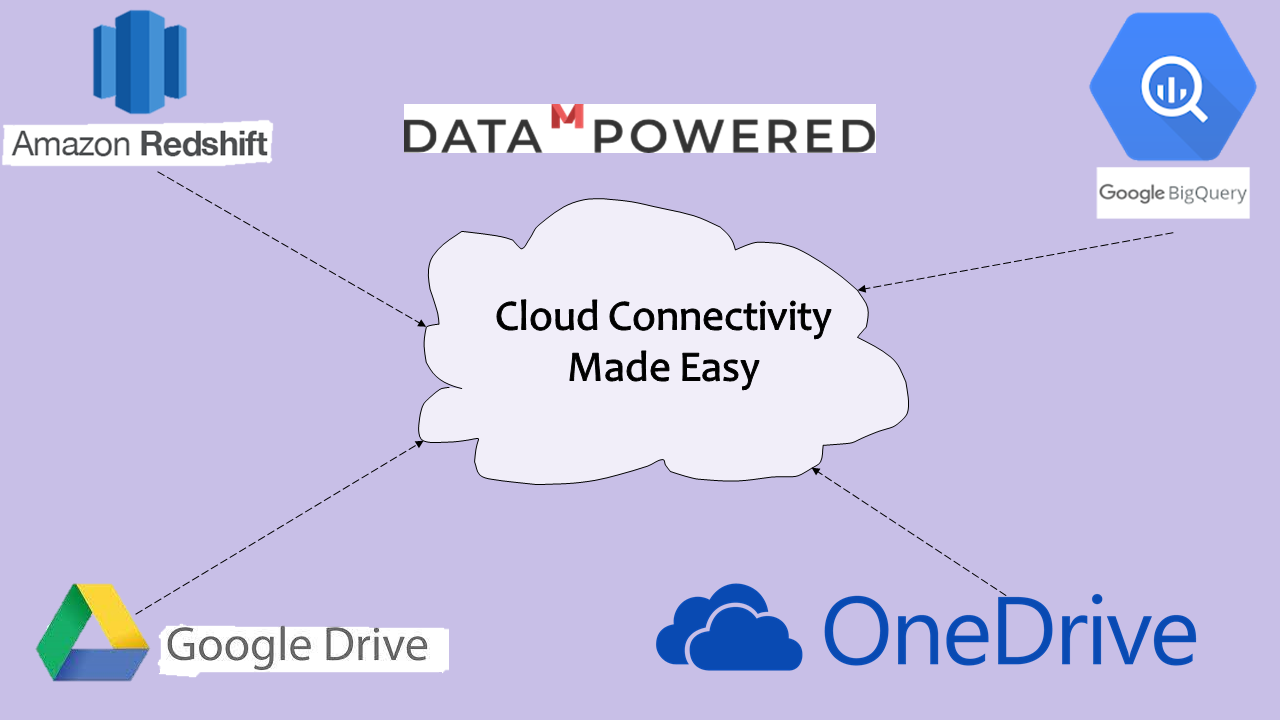
Cloud Connectors
DataMPowered allows users to connect data from various cloud platforms and storage applications. Connect cloud platforms like Amazon RedShift or Google BigQuery, or to data stored in the cloud on apps such as Google Drive or OneDrive, using our easy to follow wizard.
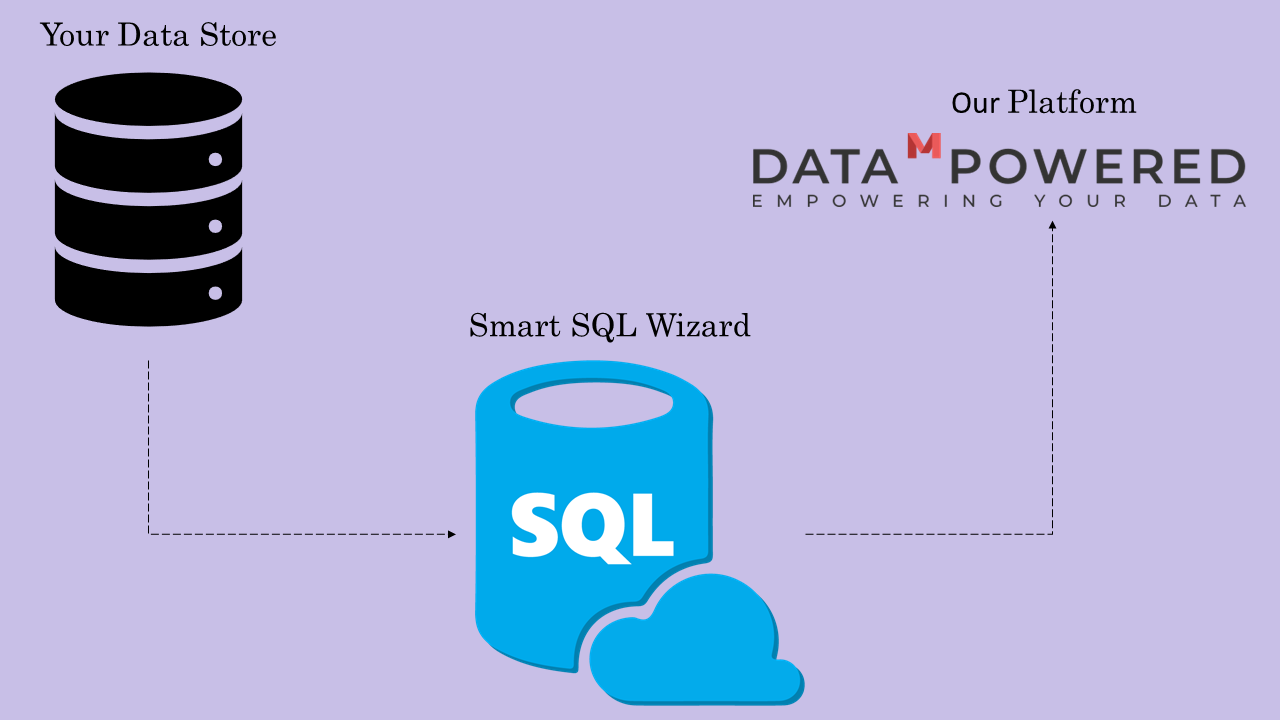
Private Connectors
Require a custom connection to a database, not covered by the connectors above? Use our downloadable SQL Wizard to easily connect to data in your own database, with limited technical expertise and no hassle.
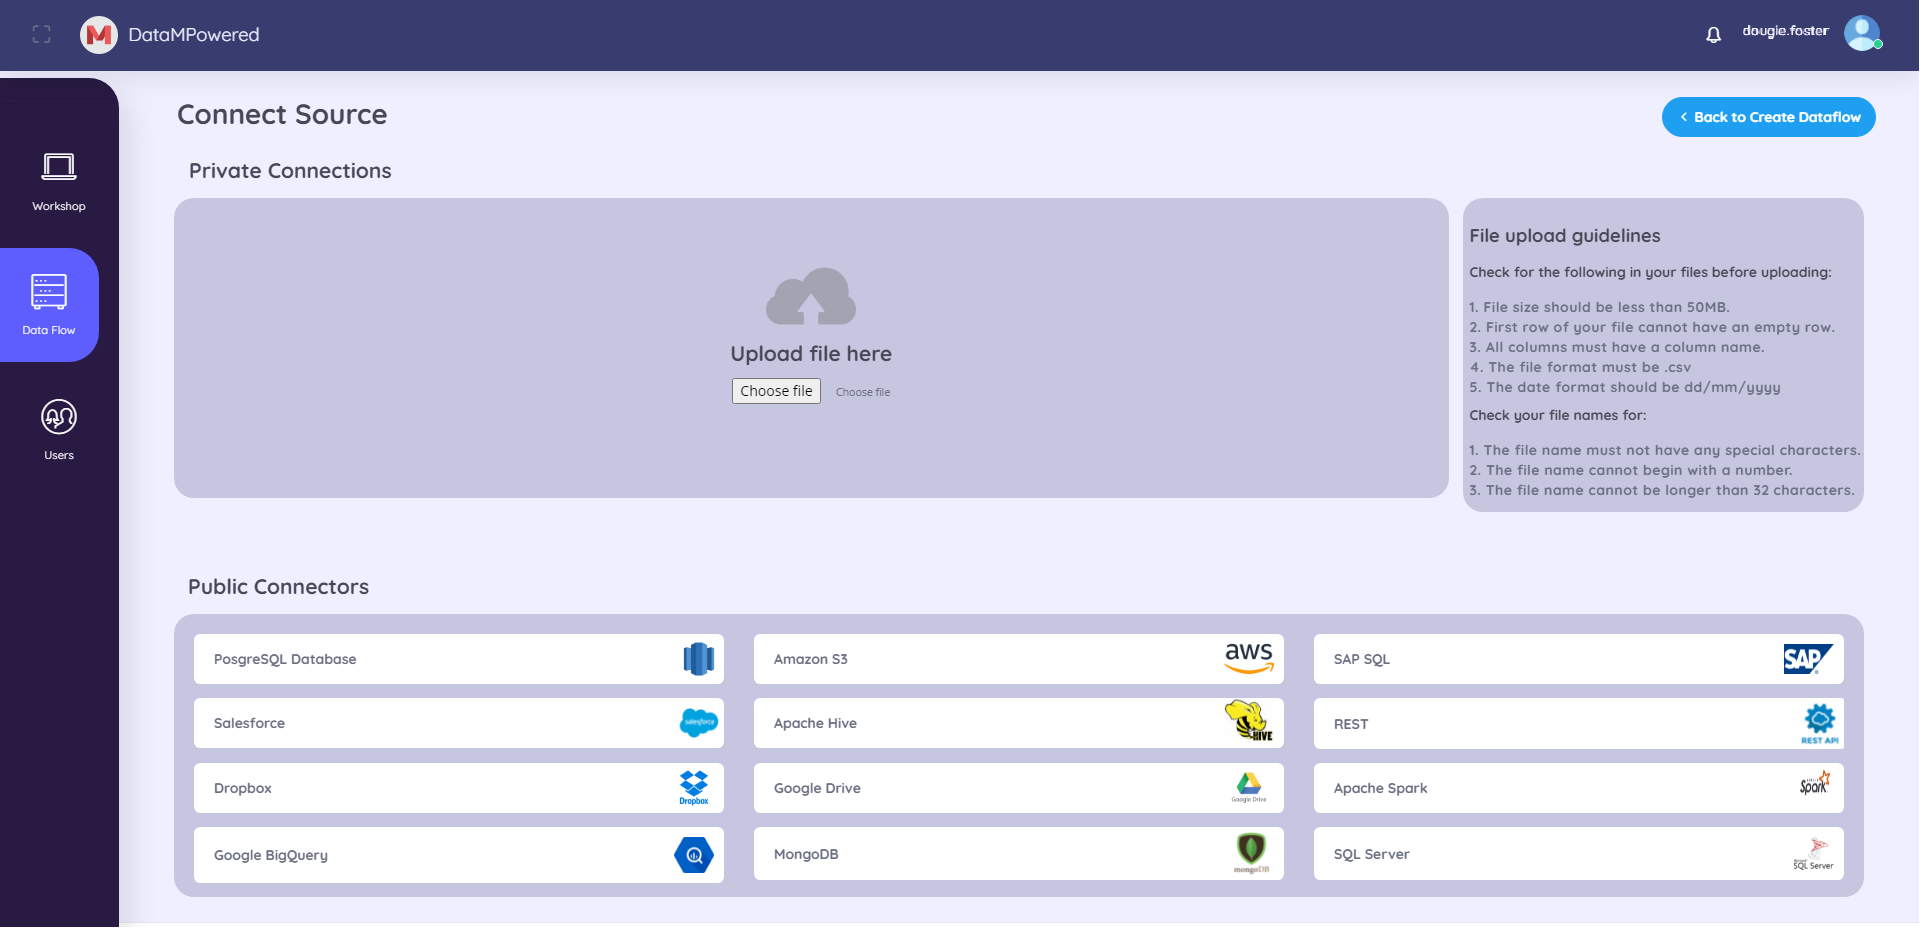
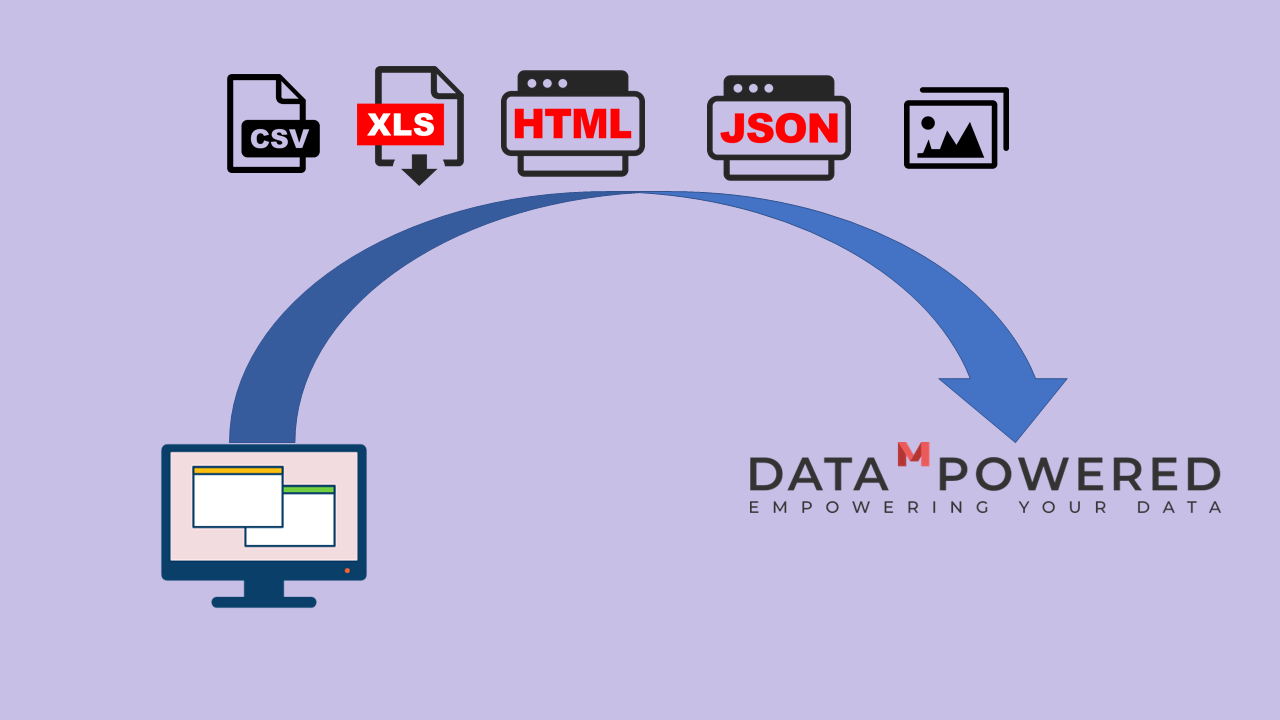
Local File Upload
Already downloaded a data-set to your computer or mobile device? DataMPowered allows you to upload various types of files, from traditional csv and xls files to database formats such as tsv, as well as capabilities to upload and analyse image files (e.g. receipts or invoices) via Optical Character Recognition (OCR) software embedded within our platform.
Key Features
Aids Cleansing
Select tables and columns from your sources for analysis easily Select which source you want to map to a Data Flow, select their tables and columns to analyse. You can label columns for ease of analysis when generating insight using natural language. The column types are auto detected based on the data of each column t will also auto describe further information about the data such as if the columns represents currency values, percentages and so on. Users can also change these column types and also change the semantic types of the data.

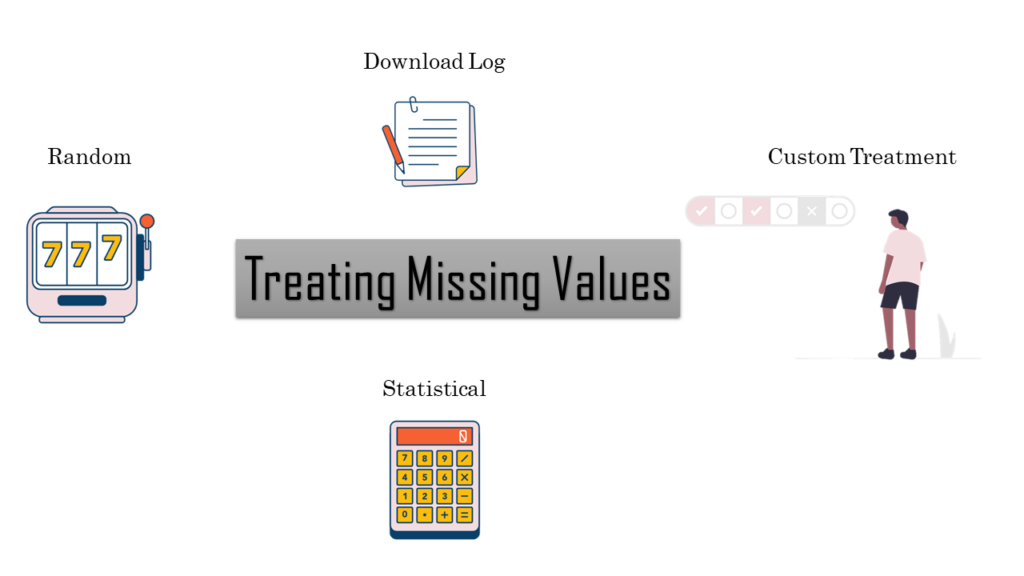
Missing Value Treatment
Select tables and columns from your sources for analysis easily Select which source you want to map to a Data Flow, select their tables and columns to analyse. You can label columns for ease of analysis when generating insight using natural language. The column types are auto detected based on the data of each column t will also auto describe further information about the data such as if the columns represents currency values, percentages and so on. Users can also change these column types and also change the semantic types of the data.
Profiling
See key details about your data, including the number of columns and rows, the size of the file you uploaded, as well as a breakdown of the different data types within the source you have connected. You can also search through the files you have uploaded to be mapped to a data flow.

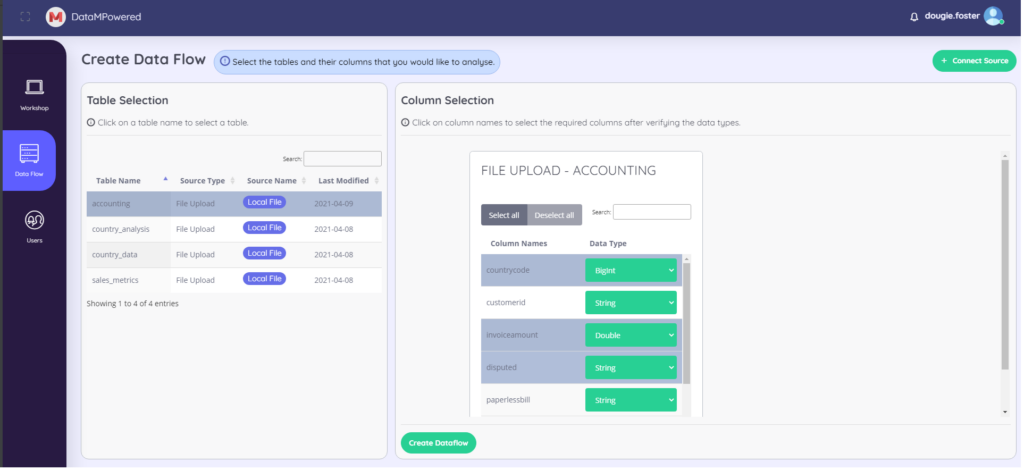
Select tables and columns from your sources for analysis easily
Select which source you want to map to a Data Flow, select their tables and columns to analyse. You can label columns for ease of analysis when generating insight using natural language. The column types are auto detected based on the data of each column t will also auto describe further information about the data such as if the columns represents currency values, percentages and so on. Users can also change these column types and also change the semantic types of the data.
Include Multiple Data Sources in a Dataflow for Analysis
If your analysis requires data from multiple sources, choose the tables and columns from their respective sources to include in the data flow. This will then auto detect any relationships between tables and join the common columns and provide a graphical representations of your selection. You can also change or add relationships between tables as required.

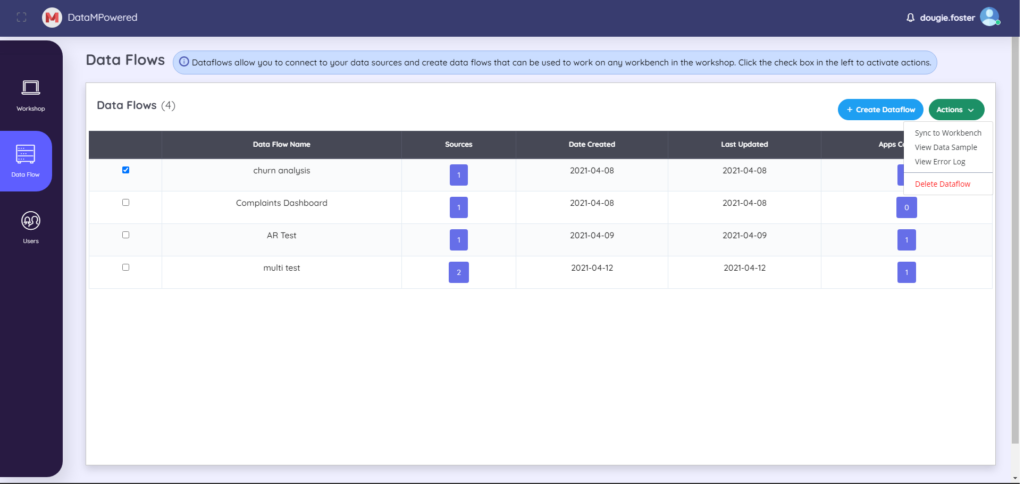
Manage Flows
Once a flow is created a variety of actions are available from one simple drop-down menu, aimed at providing you with maximum control of your data flows. Here are some of the actions you can implement to manage your data flows:
- Scheduling- Schedule when real-time data is synced with our platform, and when insights from our platform are synced back with your repositories.
- Data Sample- see a sample of the data in the data flow. You can view a sample of 50 records in an easy to navigate window, built for your convenience.
- Error log Download- Download any records of errors discovered within your data, so you can easily fix any problems at your source to be refreshed back into the flow.